Abstract
The targeted audience of this article, who wants to know the necessity of doing performance testing during the mobile and web application development so that when the user database gets increased many factors such as response time, throughput and hits per second remain stable to ensure the robustness of an application. Functional and structuring of an application is not the only the main concern in STLC where the team needs to focus, but there must also be separated allocated tasks where resource usage and scalability of AUT must be performed.
Introduction
When a mobile app is structured or a web application is developed then we must know what will be our targeted audience whether the app is for e-commerce or health or an education domain. For example, Apps, that are built for e-commerce platform needs to be very fast in all the formats related to searching for a product or categorizing the product. First and the foremost thing is the end to end transaction time and accuracy. If all the above-mentioned parameters are not mapped properly then it will end up delivering an application having poor performance prompting end-user to opt for different options available on the internet.
If an application is deployed with poor performance then it will be a great loss to reputation in terms of business as well as for sales goal. People don’t prefer to a user an app that always lags and whose waiting time is more while navigating through pages. An application that is integrated into bomb detonators, launching for a spacecraft, ventilator or any other machine used in saving the life of a person needs to be tested thoroughly to ensure their scalability when used for a longer period of time.
There will always be a need to conduct performance testing on the environment (staging) whose specification is similar to the deployment server so that application under test can perform properly after deployment.
Main parameters of performance testing:
- 1. Throughput: it is the number of transactions per second, the system can handle. As there will be a lot of users performing the transaction at the same time so to handle their request and responding them back, needs to be done in a quick way.
- 2. Response time: It is the time the user waits for the response, after sending a request from the application. This time needs to be lesser so that the user should get the response on time.
- 3. Hits per second: it is the number of hits to the server in each second of performance testing.
- 4. Error processing time: it is time which the system takes to rollback to a stable state. This needs to be lesser so that the robustness of a system is well maintained.
- 5. Transaction graph: It is the time taken by AUT (Application under test) to perform end to end transactions with success ratio.
Type of performance testing:
- 1. Load testing: It is the ability of application under test to perform well under certain user load. In this type of testing, the number of users is increased to check how the system will behave in this period of time.
- 2. Stress testing: It is the ability of application under test to perform well under extreme user load. In this type of testing, the number of users is increased to an extreme point to check the breakpoint of an application under test.
- 3. Volume testing: In this large amount of data is inserted in database and system behavior in such conditions is mapped.
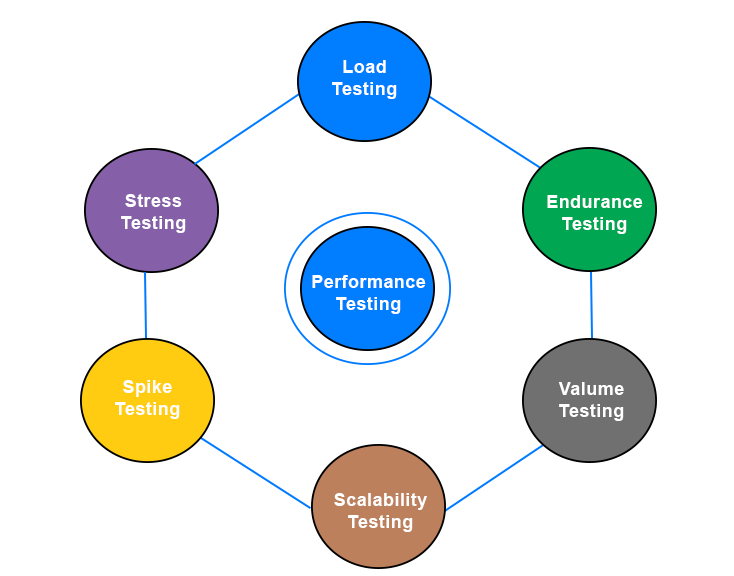
- 4. Spike testing: This type of testing is conducted by gradually increasing and decreasing the load and system behavior in such a situation is checked
- 5. Endurance testing: it is just like load testing but the motive of this testing includes for how long application under test can behave normally, in such type of user load.
- 6. Scalability testing: it ensures that application under test can perform well when there is an increase/decrease in user load, data volume.
There is a number of tools available in the market which can be used for performance testing on an application, some of the major tools used are:
- 1. WebLOAD: it is used for doing performance testing on the most complex system and can be integrated with Jenkin, Selenium. It is developed by RadView Software.
- 2. JMeter: it is an open-source tool which is used to record and automate the script and also for correlation, can be integrated with Jenkins, Blazemeter and JSunit
- 3. Loadrunner: Its give you complete graphical representation of user event with their time from end to end transaction so that it can be identified on earlier stage without deploying to live. It is compatible with cloud and mobile testing. It offers 3 edition: Community, virtual user days and Enterprise editions and can be integrated with Jenkin, Selenium, Blazemeter, and UFT.
Elaboration to Apache JMeter and latest version:
It is 100% pure Java tool that is used for load testing and measures the performance of the application under test. It is used for both static and dynamic applications. It is not a browser and it works at the protocol level, although it looks like a browser but doesn’t support all features of the browser. The latest version of JMeter is 5.0 whose minimum requirement is Java 8 or 9, it works on Windows, Linux and Mac OS platforms.
How to Install JMeter:
Step 1: To check the current version of Java is installed on your system. Go to CMD > type java – version and if it is not installed download it from this URL: https://www.java.com/en/download/
Step 2: Download JMeter file from this URL: http://jmeter.apache.org/download_jmeter.cgi, In binary section download “apache-jmeter-5.0.tgz”
Step 3: JMeter can be launch by three modes GUI, Server and Command line
Elements in JMeter
Components are referred to as elements in JMeter, these are listed below:
- 1. Test Plan: It consists of all the steps which execute the script. In this, the script runs from top to bottom, while a basic Test Plan consists of Thread group, Sampler, and Listener.
- 2. Thread Group: It is a bunch of users running on the server which may be concurrently or in the same time frame hitting the server to check the behaviour of AUT. The main parameters of Thread Group are the Number of user, the Ramp up period and Loop count to execute the script for how many times.
- 3. Samplers: This is used to identify the type of request that has been sent to the server and also if predefined parameters. Requests can be in the form of HTTPs, FTPs, SMTP, SOAP. Most commonly used is HTTPs.
- 4. Listeners: This is used to capture the whole response from the server and present them in the form of a table or tree or Graph. This is the most important part of JMeter as we analyzed the behavior of AUT along with the graph and checking the performance.
- 5. Workbench: This is a non-testing component that can be later added to the Test plan for execution. This is basically for experiments but it won't be saved in your JMeter script.
- 6. Assertion: When the server responds back then it needs to be validated that we are getting a correct responses about what response assertion is required. Types of assertion: Response, duration, HTTP, XML and Size assertions.
- 7. Config Element: When a user hits the server then there are multiple requests, which are sent to the server. These request can be further divided by means of config elements which runs before the actual request, for eg: To read values from CSV file, we need to add CSV Data Set Config in config element.
- 8. Logic Controller: There are multiple sets of requests which are sent to server to control the flow for what logic controller is used. Say, if we want to run a registration script first instead of the Login script.
- 9. Timer: When there are hundreds of users than to reduce the load on the server, we need to provide time delay between each request. For example, there can be a delay of 10 sec between HTTPs request an SMTP request
How to Run Jmeter
GUI mode: Navigate to this path: apache-jmeter-5.0\bin\jmeter and click on .bat file:
Jmeter Configuration for Script Recording.
1. To create a Test plan follow below-mentioned points in the screenshot:

2. After template creation, click on HTTP Request Defaults and Add server name or IP.
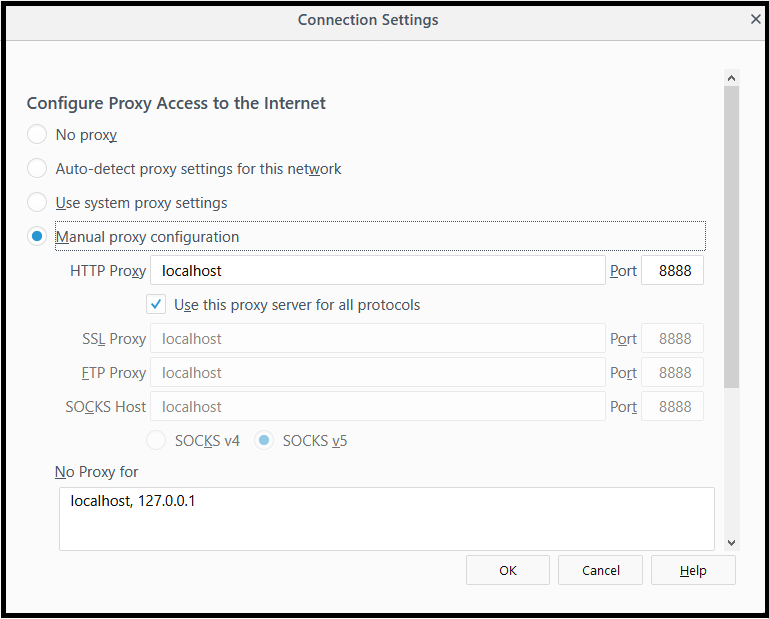
3. Configuring Firefox browser to use JMeter proxy: Open firefox and type about:preferences#advanced, in Network proxy click on settings, choose radio button as Manual proxy configuration, in HTTP Proxy add localhost and Port number as 8888.
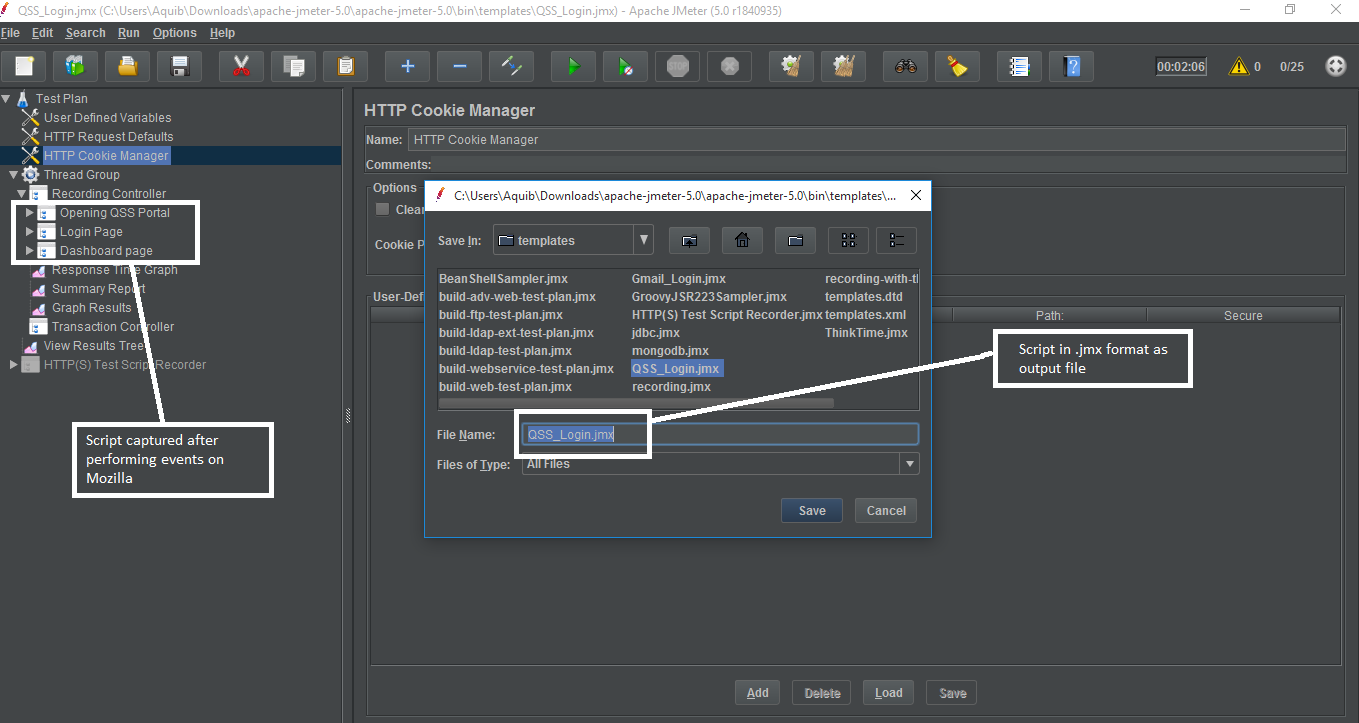
4. To record script add Test Plan>>Add>>Non Test Element>>HTTP(S) Test Script Recorder in JMeter window and now click on the Start button in HTTP(S) Test Script Recorder and record the action in the browser on which you want to perform load testing.
5. Perform events on Mozilla, its script will auto captured on JMeter. Save this script and based on load add users in your ThreadGroup.
6. Once the script is recorded use parameterization and correlation to handle dynamic data and dynamic data at run time.
7. Add Listeners in scripts as per your requirement to capture execution results.
How to Execute Load on Created Scripts:
Go to Thread Group and set number of threads for which you want to run the load.(1 Thread = 1 Virtual User). Now click on the play icon in the header to start load execution.
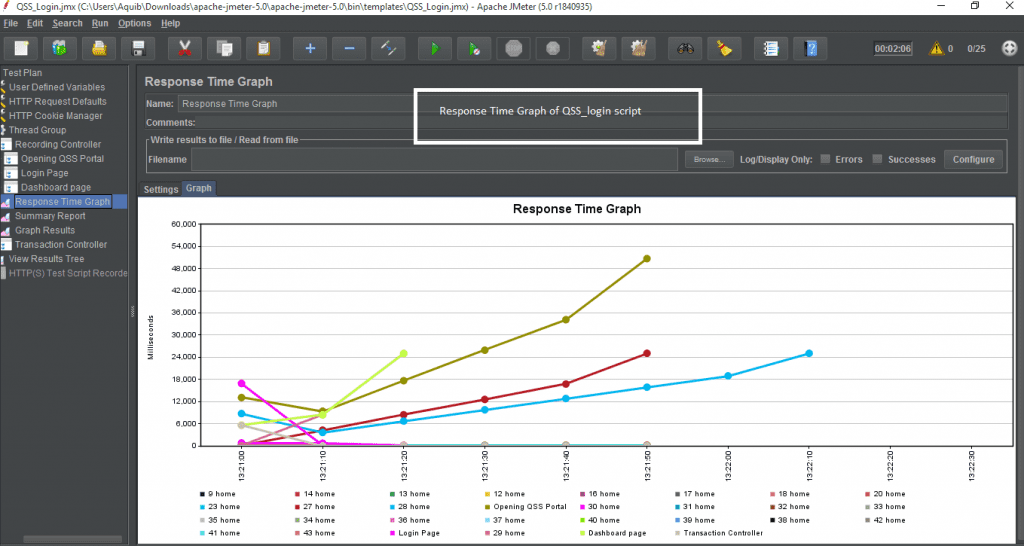
Performance Execution Reports View:
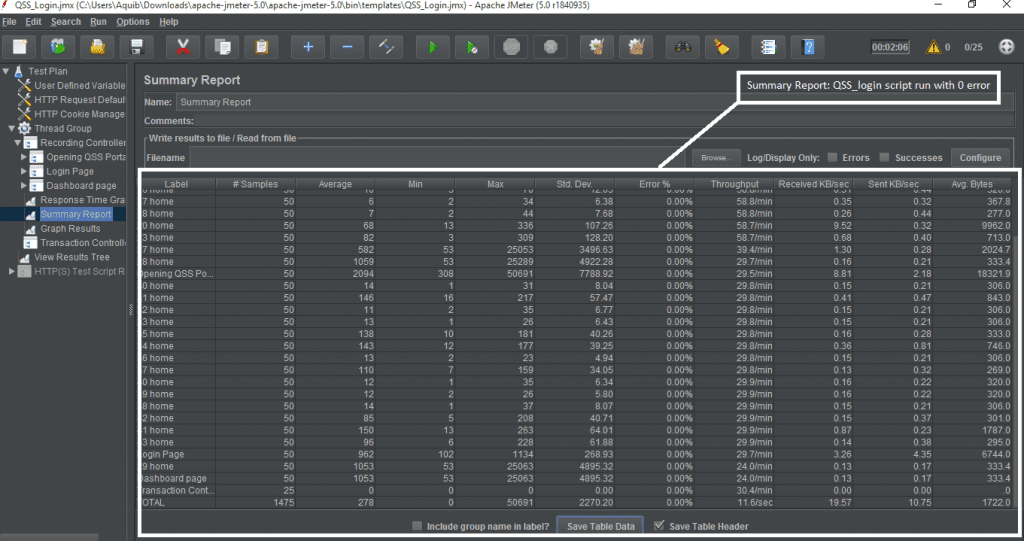
Response Time Graph:
Also Read: How to handle Parameterization and Correlation in JMeter?
About Author:
Prakhar Saxena is a Sr. QA Engineer currently working with QSS Technosoft Pvt Ltd. He has completed his Master’s degree in Information Technology.
About QSS:
QSS has a proven track executing enterprise level web and mobile applications for its esteemedcustomers. QSS has a test center of excellence with a dedicated and experienced team of QAengineers. To Know More...

How to use JMeter for Performance and Load Testing?