Datadog for E-Commerce: Turning Production Data Into Engineering Decisions
 By Ved Dwivedi
Senior Software Engineer, QSS Technosoft
September 17, 2026
9 min read
Updated Sep 18, 2026
By Ved Dwivedi
Senior Software Engineer, QSS Technosoft
September 17, 2026
9 min read
Updated Sep 18, 2026
Quick Answer
Here’s the short version. Datadog earns its place on an e-commerce platform not by surfacing error messages, but by letting an engineer follow one transaction across everything it touched: the frontend, the APIs, a dozen backend services, a database, a cache, and whatever runs asynchronously after the customer has already closed the tab. The skill that actually matters isn’t reading a stack trace. It’s reconstructing what happened to an order when nothing in any single service looks obviously wrong, and doing it fast enough that investigating doesn’t become the whole incident.

The Backend Behind One Click
From the customer’s side, an e-commerce app is simple. Browse a few products, add something to the cart, click Place Order, get a confirmation. Thirty seconds, maybe less. Nothing about that screen hints at what’s actually happening underneath it.
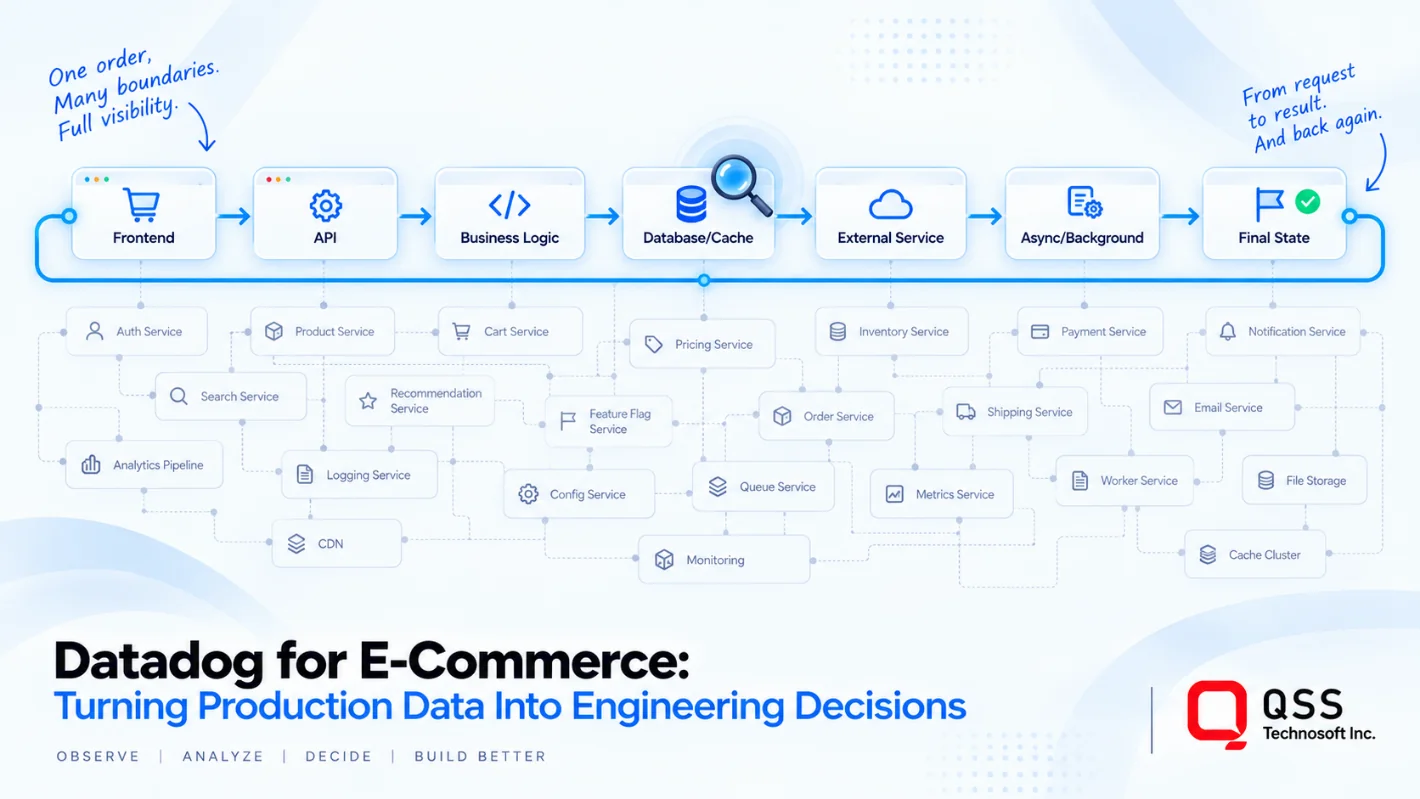
That one click doesn’t talk to a single system. It talks to many. The request passes through the frontend, hits an API, gets validated by the business logic layer, checks inventory, requests payment, and finally gets written to a database. At the same time, a set of services the customer never interacts with directly (cart, pricing, catalog, notifications, search indexing, inventory sync, fulfillment) all pick up their own part of the work, and a good chunk of that happens asynchronously, well after the customer has already closed the tab. On a real platform, it’s routine for ten or fifteen services to be involved in what looks, from the outside, like a single action.
None of that complexity is a design flaw. It’s what a distributed system looks like once it’s actually handling real traffic, real inventory, and real payments at scale. The complexity is simply the cost of doing this well. The problem shows up later, on the day something breaks and someone has to figure out where.
Why Broken Isn’t a Root Cause
A support ticket that says the customer couldn’t place the order describes an outcome, not a cause. It doesn’t tell you which of those ten or fifteen services is responsible, and in a lot of cases, no single service is cleanly at fault at all. Every individual call can return a perfectly healthy response while the order still ends up in the wrong state, because two services quietly disagreed about what should happen next.
Searching a production environment without an anchor point is how investigations turn into guesswork. What actually works is starting from a business identifier: an order ID, a user ID, a request ID, a correlation or trace ID, whatever ties the events together, and using it to pull every log, span, and metric connected to that one transaction. Once you have that, you’re not checking fifteen services one at a time hoping to get lucky. You’re looking at a single thread that runs through all of them, in the order things actually happened rather than the order you assume they happened in.
That single habit is usually the difference between an investigation that takes ten minutes and one that takes three. Most of that three hours, in practice, gets lost to searching without an identifier at all.
Evidence, Not Assumptions
The instinct when something breaks is to search for the word ERROR and stop at the first result. That’s useful, but it’s an incomplete way to investigate, because a successful event can tell you just as much as a failed one, sometimes more.
Take a fairly typical order flow: received, validated, inventory checked, payment requested, order persisted, confirmation published. If the customer never got their confirmation, the most useful thing you can find isn’t necessarily an error. It might be the last event that did succeed. If validation, inventory, and payment all went through cleanly but there’s no evidence the order was ever persisted, that tells you exactly where the sequence broke down, even without a single exception in sight.

This is also where it’s worth resisting the urge to blame the first suspicious thing you see. A slow query or a timeout in one service is a signal, not automatically the answer. It’s worth asking what happened immediately before it, whether it’s isolated to one request or affecting many, and whether the timing actually lines up before calling it the root cause. A lot of quick fixes turn out, a week later, to have patched a symptom next to the real problem, because the first suspicious log looked convincing enough to stop looking.
Walking Through a Real Investigation
It helps to see this play out. Say a customer reports that their order total looked wrong after checkout. Not a crash, not an error page, just a number that didn’t match what they expected. There’s no exception to search for here at all.
Starting from the order ID, the trail shows the cart service handing off a set of line items and a subtotal, the pricing service applying a promotion, and the order service persisting a final total that doesn’t match what pricing calculated. Nothing in any single service logged a failure. Pricing did its job, the order service did its job, and the customer still got the wrong number.
The gap turns out to be timing. The promotion had an expiry condition evaluated at two different moments by two different services, a few hundred milliseconds apart, and a cart held open past that boundary picked up inconsistent state. Neither service was wrong on its own; the interaction between them was. That’s a category of bug that’s nearly invisible without being able to see all three services’ events lined up against each other in one place, and it’s exactly the kind of bug that a distributed e-commerce backend produces more of as it grows, not less.
Logs, Metrics, and Traces Aren’t Three Separate Tools
Each of these answers a different question, and the real value shows up when you move between them instead of treating them as three unrelated dashboards. Metrics tell you whether something is abnormal and how big the impact is, on one customer or a meaningful slice of traffic. Traces show you where a request actually spent its time as it crossed from one service to the next. Logs tell you exactly what a given service decided to do at a specific point in that journey.
Used separately, each one only answers part of the question: a metric shows something spiked, a trace shows where, a log shows exactly why. Together, they turn a vague failure into an actual, readable sequence of events, instead of three separate investigations that never compare notes.
At Scale: When Ten Services Become Fifty
Everything above holds at small scale, but the value compounds as the architecture grows. A platform that starts with ten services rarely stays at ten. New capabilities become new services, existing ones get split for independent scaling and deployment, and within a couple of years it’s normal to have thirty, fifty, or more services owned by a dozen different teams, each deploying on their own schedule, each with their own on-call rotation, each reasonably confident that their own service is healthy.
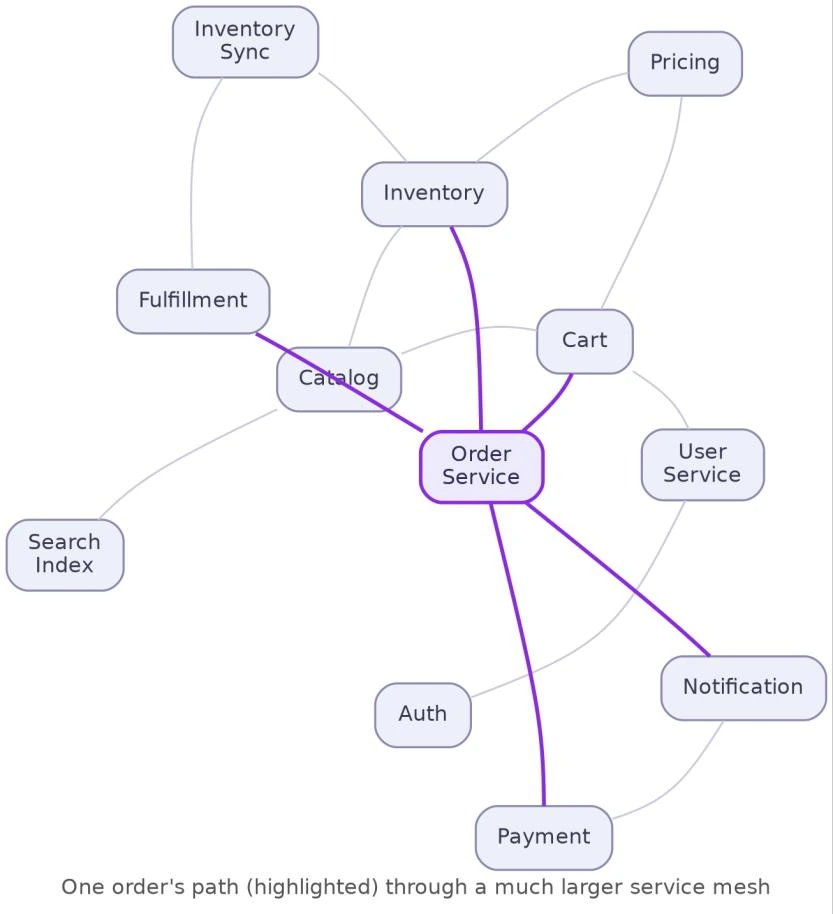
That’s exactly the environment where figuring out which team owns the broken thing becomes its own investigation, on top of the technical one. An engineer troubleshooting a stuck order doesn’t necessarily know, and shouldn’t need to know, the internals of a service six teams away. What they need is to see that a specific request touched that service, at a specific time, and got a specific result. Distributed tracing and service-level telemetry make that visible without requiring anyone to read someone else’s codebase first. The value isn’t just diagnosing faster. It’s diagnosing without needing a Slack thread across five teams just to locate the right one.
This is also where dependency visibility starts to matter on its own, separate from any single incident. Seeing which services a given workflow actually touches, not which services someone thinks it touches based on a diagram that’s a year out of date, is often the first real surprise a team gets when they look closely. Architectures drift. Dependencies get added quietly, in a two-line code change, without anyone updating anything they’d call documentation. Production telemetry doesn’t drift. It reflects what’s actually happening.
What This Changes for Developers
For someone writing code day to day, production telemetry stops being something you only look at during an incident and starts being part of how you build. Shipping a change to the checkout flow and being able to see its actual effect on latency and error rate, for real traffic, within the hour, rather than waiting for a support ticket to notice, changes how confidently you can iterate. It also changes how you debug locally: instead of trying to reconstruct an edge case from a bug description, you can pull up exactly what happened in production and work from real data instead of a guess.
It also reframes what done means for a feature. A feature that passes tests and deploys cleanly hasn’t necessarily been observed doing the right thing for real users yet. Adding meaningful, structured context to logs (a request ID, an order ID, the operation being performed, whether it succeeded, failed, or is still pending) during development, rather than bolting it on later during an incident, is a small habit that pays for itself the first time someone needs to trace a transaction through code you wrote.
What This Changes for Production Support
For the people who pick up the pager, the shift is just as real, but it shows up differently. A lot of the time lost during an incident isn’t spent fixing anything. It’s spent figuring out where to look, and then convincing another team that the problem is actually in their service and not yours. An evidence-backed trace through the actual sequence of events cuts through both of those at once. It’s a very different conversation to point at the exact trace and the exact moment a service returned something unexpected than to say checkout seems broken and ask someone to go look at their service.
It also changes how incidents get communicated upward. Saying you’re still investigating is a weak update. Saying you can see the issue is affecting roughly four percent of checkouts in the last twenty minutes, isolated to orders using a specific payment method, is a strong one, and that level of detail is only available when metrics, traces, and logs are actually connected to business context, not just infrastructure health. For production support, that’s often the real difference between an incident that resolves in twenty minutes and one that takes two hours, because most of that gap isn’t fixing time. It’s figuring-out time.
More Than a Tool for When Things Break
It’s easy to treat observability as something that only matters during an incident. In practice, the same telemetry is just as useful on an ordinary day: did a recent deployment change latency for a specific workflow, is a background job behaving differently than it used to, which dependency is quietly the slowest link in the chain, is a newly added service actually being called the way its design assumed it would be.
Used that way, Datadog stops being a place you visit only when something’s on fire, and becomes part of how the team actually understands the system it’s building. Developers get to verify their assumptions against reality instead of hoping tests covered the right cases. Production support gets to triage with evidence instead of guesswork, and hand off context instead of starting from zero. And the architecture itself gets easier to reason about over time, because the gap between what people think the system does and what it actually does keeps shrinking instead of quietly growing.
That’s really the shift that matters here. Not fewer moving parts, because a distributed e-commerce backend is never going to have fewer of those, but the ability to see how all of them behaved together on one specific transaction, instead of debugging each service blind and hoping the pieces add up.
How QSS Technosoft Applies This
The habits in this article are how our engineering and production-support teams work on the e-commerce and enterprise platforms we build and run: business identifiers in every log from the first sprint, traces connected to order and customer context rather than infrastructure health alone, and incident updates that state scope in customer terms. On Datadog specifically, that means instrumenting services with consistent request and order IDs, defining SLOs on the workflows a customer would recognise (checkout, payment, fulfilment) rather than on individual services, and building the dashboards on-call actually opens.
We offer this as part of our cloud engineering and DevOps and performance and reliability engineering services, and as managed production support for platforms that cannot afford a two-hour incident.
Running an e-commerce backend that is harder to debug than it used to be?
A 30-minute conversation with an engineer who does this on production systems, not a salesperson. Bring one recent incident; we will walk through how it would have been traced end to end, and what instrumentation would have shortened it. You keep the written notes either way.
Book a Call →