Hospital Performance Analytics: How to Turn Data into Better Decisions
 By Vineet Bhardwaj
QSS Technosoft
October 21, 2026
15 min read
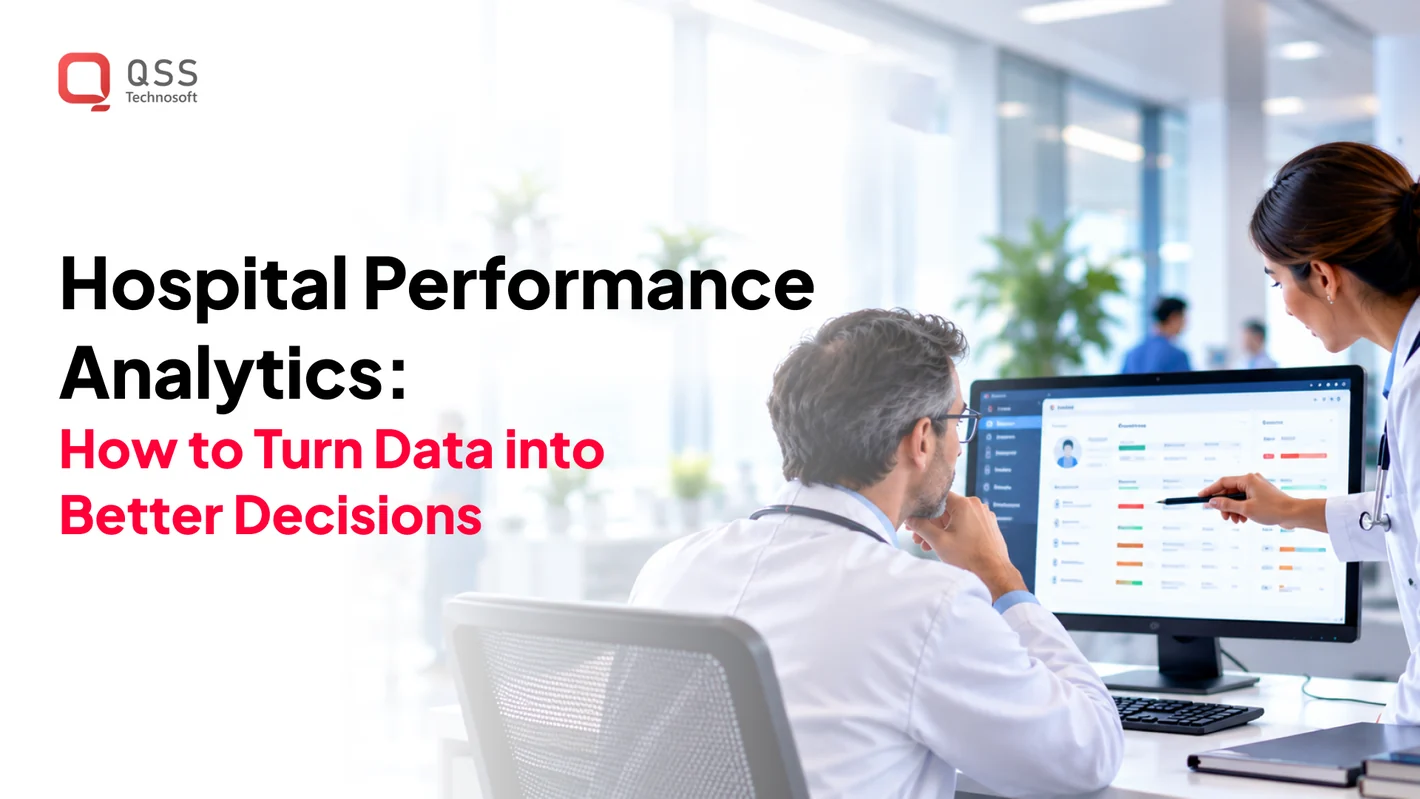
Hospital analytics software development connects clinical, operational, and financial data to decisions people can act on. It works when teams can trace a measure to its source, understand how it is defined, and know who should respond. A useful analytics workflow is more than a dashboard: it includes validated data, clear ownership, and a review process.
Hospital leaders often face a practical challenge: relevant data is spread across EHRs, financial platforms, and operational systems, and teams may define the same measure differently. Even a polished dashboard can miss the mark if users can’t tell what a result means or who should follow up.
This article explains how to choose measures that support real decisions, connect the data behind them, and establish clear ownership and validation. It also covers how interoperability, data pipelines, and usable visualizations fit together, and which implementation choices affect trust and adoption. For CIOs, CMIOs, IT and operations leaders, the goal is to turn hospital data into information teams can use. QSS Technosoft Inc. is a US-based software engineering company supporting healthcare organizations with interoperability, analytics engineering, and custom software development.
Quick Answer
Hospital analytics software development turns clinical, EHR, operational, and financial data into measures that specific people can act on. Start with one decision, such as capacity, discharge timing, or denials, and a named owner. Then trace the measure from source systems through interfaces (HL7 or FHIR where they fit), a data pipeline, documented metric logic, and an analysis layer before building a dashboard. Match descriptive, diagnostic, predictive, or prescriptive analysis to the question and the data you actually have. Validate results against source records and with the people who will use them, control access with privacy in mind, and set a review cadence so each measure is kept, revised, or retired rather than adding to dashboard sprawl.
What is hospital performance analytics, and what decisions should it support?
Hospital performance analytics uses clinical, operational, and financial data to understand how a hospital is performing and inform specific decisions. It puts measures in context for leaders and care teams. A dashboard can display results, but the display alone doesn’t show whether anyone acted or whether operations changed.
Hospital performance analytics connects relevant hospital data to consistent measures so decision-makers can choose and review actions.
Start with a decision that needs better evidence, not a chart or technology choice. The Health care analytics overview describes the field’s range of applications, but hospital teams still need to define the questions that matter in their own setting.
Which hospital decisions can performance analytics support?
Performance analytics can inform decisions across care delivery, capacity, workflow, and financial operations. It provides evidence for accountable people to interpret; it doesn’t independently diagnose patients or guarantee better outcomes.
- Care delivery: A CMIO or quality leader might ask whether a clinical process is being followed consistently, then decide whether to review the workflow, documentation, or measure definition.
- Capacity: An operations leader might examine how demand relates to available beds, then consider staffing, patient flow, or escalation plans.
- Workflow: A department manager might look for variation in a handoff or service process, then decide where to investigate delays or clarify responsibilities.
- Financial operations: A CFO or revenue cycle leader might review patterns in denials or billing activity, then prioritize process analysis or staff follow-up.
These are questions to investigate, not conclusions built into the software. The measure, time period, and context determine what a result can reasonably tell a team.
Why do hospital reports fail to become useful insight?
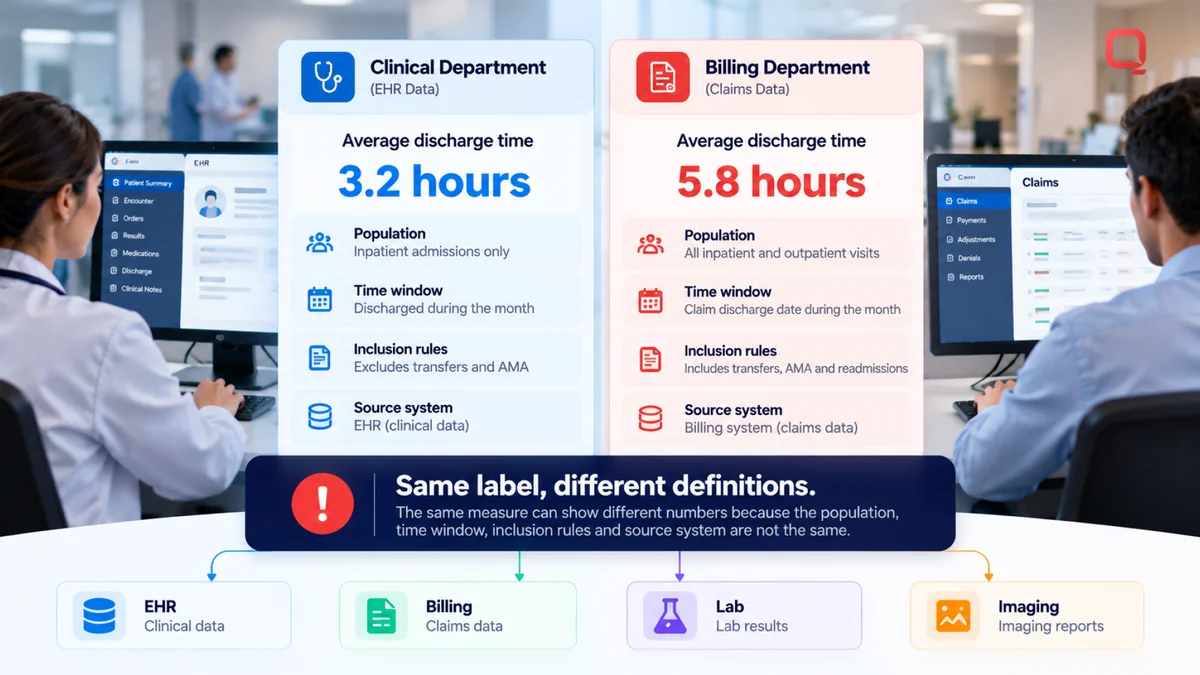
Reports often stall because source systems capture different parts of the work, and teams may define measures differently. A comparison can mislead when its populations, time windows, or inclusion rules don’t match.
Fragmented systems add practical friction. Clinical records, billing platforms, laboratory systems, and imaging systems may each hold data relevant to a question, but no single report automatically makes those records comparable. Teams can end up debating which number is correct instead of deciding what it means.
Ownership is another common gap. A dashboard may show a measure without naming who reviews it, what action is in scope, or when the result should be revisited. That turns performance reporting into a passive destination. Hospital analytics software development should support a decision workflow, not just publish more charts. Visibility alone is not evidence of operational improvement unless teams share definitions and follow up.
How does hospital performance analytics move data into usable insight?
Hospital performance analytics moves data from relevant source systems through ingestion, transformation, metric logic, analysis, and presentation. Each stage affects what a result means. A sound data flow makes the path from a recorded event to a reported measure understandable, testable, and useful for a defined decision.
What belongs in a hospital analytics data flow?
A hospital analytics data flow is the sequence of systems and processing steps that prepares selected data for analysis. Begin with the question and include only the sources needed to answer it. A question about billing operations may require billing records, while a question about imaging workflow may involve imaging system data.
Source data records events, a governed metric defines how selected records are counted, and an analytical output presents the result for interpretation.
Keeping these layers distinct helps teams trace a displayed value back to its rules and inputs.
A simple flow looks like this:
Source systems → interfaces → data pipeline → metric logic → analysis destination → report or dashboard Flow description: Source systems capture the underlying activity. Interfaces move selected data between systems. The data pipeline ingests and transforms it. Metric logic applies approved definitions. The analysis destination organizes prepared data for querying. A report or dashboard presents the result to its intended users.
An EHR or EMR may provide clinical events, while a laboratory system may provide results needed to analyze testing workflow. Include billing data when the measure concerns claims or revenue cycle activity. Imaging data is relevant when a decision depends on imaging operations. HL7 messaging and FHIR-based exchange can support the movement of health information between systems; the right approach depends on the systems, data, and use case.
Consistent identifiers help associate records with the right patient, encounter, or department. Timestamps need clear definitions, such as whether they represent when an event occurred or when it was recorded. Transformation rules also need to be visible, because the same source values can produce different interpretations downstream. External reference data can provide additional context for some analyses. For example, the Healthcare Cost and Utilization Project (HCUP) offers U.S. healthcare databases and tools for analysis.
How should teams handle data quality, access, and governance?
Governance makes the data flow reviewable. Assign business ownership for each measure, record its definition and intended use, and document the transformations that produce it. Analysts and operational leaders then have a shared basis for interpreting the output.
Validation should check whether required fields are present, identifiers match as expected, timestamps fall within the intended period, and transformed values follow documented rules. When a check fails, teams need a visible process for investigation instead of silently treating incomplete data as reliable.
Privacy and security belong in the design from the start. Define who needs access to which data, limit exposure to what the analysis requires, and consider how data is handled during ingestion, storage, and reporting. HIPAA is relevant context for U.S. healthcare organizations, but a technology design alone is not a compliance guarantee. See QSS’s contact page for information about discussing an analytics data flow.
Which hospital performance analytics approach fits the question?
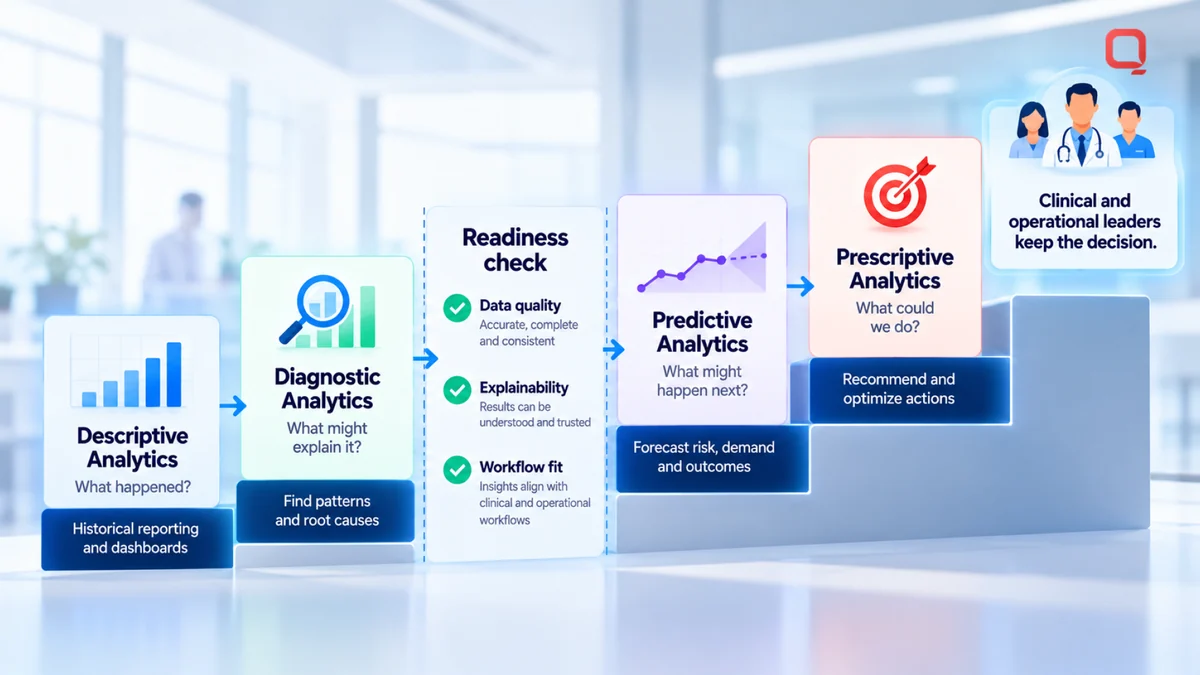
Choose an analytics approach based on the decision and available evidence, not because a method sounds more advanced. Descriptive analysis summarizes what happened, diagnostic analysis explores possible drivers, predictive analysis estimates what may happen, and prescriptive analysis compares possible actions. This table is a conceptual framework, not a ranking or a promise of outcomes.
| Approach | Question it answers | Typical input | Output | Operational limitation |
|---|---|---|---|---|
| Descriptive | What happened? | Historical, defined measures | Summary, trend, or comparison | Reports past activity, not what caused it or what to do next. |
| Diagnostic | What might explain what happened? | Historical measures and related factors | Patterns or potential contributing factors | Patterns do not establish cause without further investigation. |
| Predictive | What might happen next? | Suitable historical data and relevant variables | Estimate of a possible future condition | Data limitations and model uncertainty affect interpretation. |
| Prescriptive | What actions could be considered? | Predictions, constraints, and candidate actions | Comparison or recommendation of possible actions | Recommendations need workflow fit and appropriate human review. |
Analytical capability and implementation readiness are different. A method may be technically feasible but unsuitable if its data is incomplete, its output can’t be explained to users, or no team can act on the result. Hospital analytics software development should match the method to the decision, available data, and operational process.
When is descriptive or diagnostic analytics enough?
Descriptive analysis is often sufficient when a team needs a reliable account of activity over a defined period. Diagnostic analysis goes further by exploring factors that may relate to a pattern. Neither requires a forecast to be useful.
Hypothetical hospital operations example: A unit manager sees that discharge timing varies across days. Descriptive analysis summarizes the pattern. Diagnostic analysis might explore whether the timing appears alongside differences in service availability or workflow steps. The manager can use those findings to decide what to investigate. A correlation or recurring pattern is not proof that one factor caused another.
When should a hospital consider predictive or prescriptive analytics?
Predictive analysis estimates possible future conditions from suitable historical data. A hospital might explore it when leaders need an earlier signal for planning, but the estimate should be treated as decision support, not certainty.
Prescriptive analysis evaluates possible actions against defined objectives or constraints. Where actions could affect care, clinical and operational leaders should review the recommendation and retain responsibility for the decision.
Before moving beyond historical reporting, assess data quality, explainability, and workflow fit. If users can’t understand what an output represents, or there’s no practical response to it, added analytical complexity may create noise rather than value.
How can a hospital implement performance analytics without creating dashboard sprawl?
Implement hospital performance analytics by starting with a decision, assigning ownership, validating the measure and data, and then rolling out a focused view to its intended users. Review whether it informs the decision before expanding. This staged approach keeps development tied to real workflows instead of producing reports without a clear audience or next step.
How should teams scope the first analytics use case?
Choose one clinical or operational decision and identify who will use the analysis. Before development begins, record the measure’s definition, source systems, accountable owner, review cadence, and intended action. Keep the initial scope narrow enough to test whether the data is available and the output fits users’ workflows.
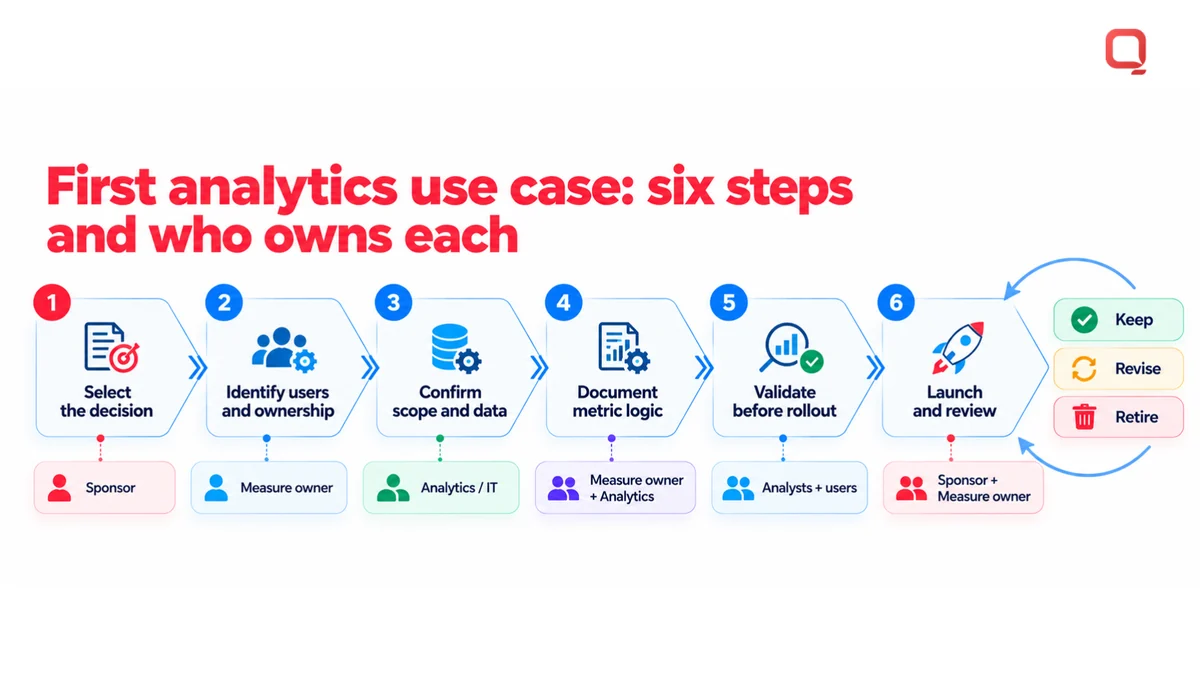
- Select the decision. The operational or clinical sponsor identifies a question that needs evidence and defines the decision the analysis should support.
- Identify users and ownership. The department leader or measure owner names the people who will review the output and the person responsible for its definition.
- Confirm scope and data. The analytics or IT team maps the measure to source systems and checks whether the required records and fields are accessible for the intended use.
- Document metric logic. The measure owner and analytics team record the population, time period, inclusion rules, exclusions, and calculations. Make assumptions explicit.
- Validate before rollout. Analysts compare results with source records, while representative users review whether the definition and interpretation match the decision they need to make.
- Launch and review. The sponsor coordinates rollout, and the measure owner reviews the output on the agreed cadence. Keep, revise, or retire it based on its usefulness.
Validate a measure with the people who will use it before wider rollout. A technically correct number can still answer the wrong operational question.
How should teams validate, launch, and maintain analytics?
Validation should test both the calculation and its meaning. Analysts can trace sample outputs to source records and investigate discrepancies. Intended users can confirm that labels, filters, and time periods support the defined decision rather than inviting a misleading comparison.
Before launch, document who can access the output, who owns the metric, how changes to its logic are recorded, and how questions or discrepancies are resolved. These responsibilities can sit with existing roles and teams; the process matters more than creating a fixed staffing structure.
- Scope: Is there a named decision and intended user?
- Data: Are the necessary sources and fields available?
- Definitions: Are calculation rules and assumptions recorded?
- Validation: Have outputs been checked against source records and reviewed by users?
- Access: Are access expectations and ownership documented?
- Adoption: Is there a review cadence and a clear follow-up action?
Don’t add another dashboard simply because data exists. First determine whether the current output informs its intended decision and whether users can interpret it consistently. More information about hospital analytics implementation is available through QSS.
How can QSS Technosoft support hospital performance analytics development?
QSS Technosoft is a US-based healthcare software engineering partner that supports hospitals in connecting relevant systems, preparing data, defining analytics workflows, and building dashboards for specific operational or clinical decisions. The work is shaped around the organization’s technology and needs. QSS supports the engineering behind analytics, rather than offering a named analytics product.
What engineering capabilities can support a hospital analytics workflow?
Hospital analytics software development includes the connections, data processing, measure logic, and user-facing tools that move source records into usable analysis. QSS brings healthcare interoperability and software engineering capabilities to those components, with scope shaped by the use case and the hospital’s current systems.
An analytics workflow may need EHR or EMR integration for clinical data, or HL7 and FHIR interfaces to support exchange between systems. DICOM and PACS integration may be relevant when a measure depends on imaging workflow data. Not every source belongs in every workflow: include systems when their data supports the defined question.
Data pipelines can prepare selected inputs for analysis, while BI and data visualization can present measures in a form suited to their users. A dashboard is only one component. Metric definitions, transformations, and validation must also align with the intended decision. Cloud engineering can support the environment that runs the workflow, and legacy modernization may help where older systems complicate integration.
There is no universal architecture for every hospital. Source systems, interface availability, data quality, access needs, and organizational priorities all shape the design. Privacy and security considerations belong in that design work, but a development approach should not be treated as a blanket compliance guarantee.
What should hospital leaders bring to an initial discussion?
A focused discussion begins with the decision, not a dashboard wish list. Bring the measure definition, intended users, source systems, known data constraints, and the action the analysis may inform. These details give clinical, operations, IT, and executive stakeholders a concrete starting point for defining scope together.
- Decision: What question should the analytics workflow help answer?
- Measure: How is the measure defined, and who owns that definition?
- Data: Which systems contain relevant records, and what limitations are already known?
- Users: Who will interpret the result and decide what happens next?
- Review: How will the team validate the measure and assess whether it remains useful?
Aligning these details early helps prevent technical scope from outrunning operational needs. QSS’s company profile lists 250+ in-house engineers and 400+ projects delivered, alongside healthcare interoperability, data pipeline, and visualization capabilities. Details about QSS’s hospital analytics development support are available online.
Make the Next Analytics Decision Actionable
Choose one decision where clearer evidence could change how a team plans, prioritizes, or follows up. Keep the first objective focused. A well-scoped hospital analytics software development effort gives stakeholders a concrete way to test whether the data, measure, and workflow fit together before expanding the work.
Bring clinical, operations, and IT perspectives into the discussion early. Shared understanding can turn an analytics request into a practical engineering scope and surface constraints that are easier to address before development begins. Make the decision and its ownership clear, then build only what supports them.
QSS Technosoft works with healthcare organizations on the integration and engineering behind hospital analytics workflows. Start a conversation about your hospital analytics project to define a focused path from the decision you need to support to a solution your teams can use.
Good analytics starts with a useful question. Make that the first thing you build on.
Turn One Hospital Decision Into a Trusted Measure
Bring the decision you want to support, the measure definition, and the systems that hold the data. Our engineers offer healthcare software development services, custom healthcare software development, and custom medical software development for hospital analytics, from healthcare interoperability and HL7 and FHIR integration tools for healthcare to EHR software development company expertise in EHR/EMR integration, data pipelines, and dashboards your teams can trace and trust.
Start a conversation about your hospital analytics project →